Blog
Bacon: Vegas' other favorite 'strip' that sizzles on Hawaiian sands, too
Hawaii and Nevada have the most bacon-obsessed restaurant customers in the U.S., and Alaska has the least. Where does your state rank?
March 29, 2019
 ChatGPT
 Grok
Grok Perplexity
 Claude
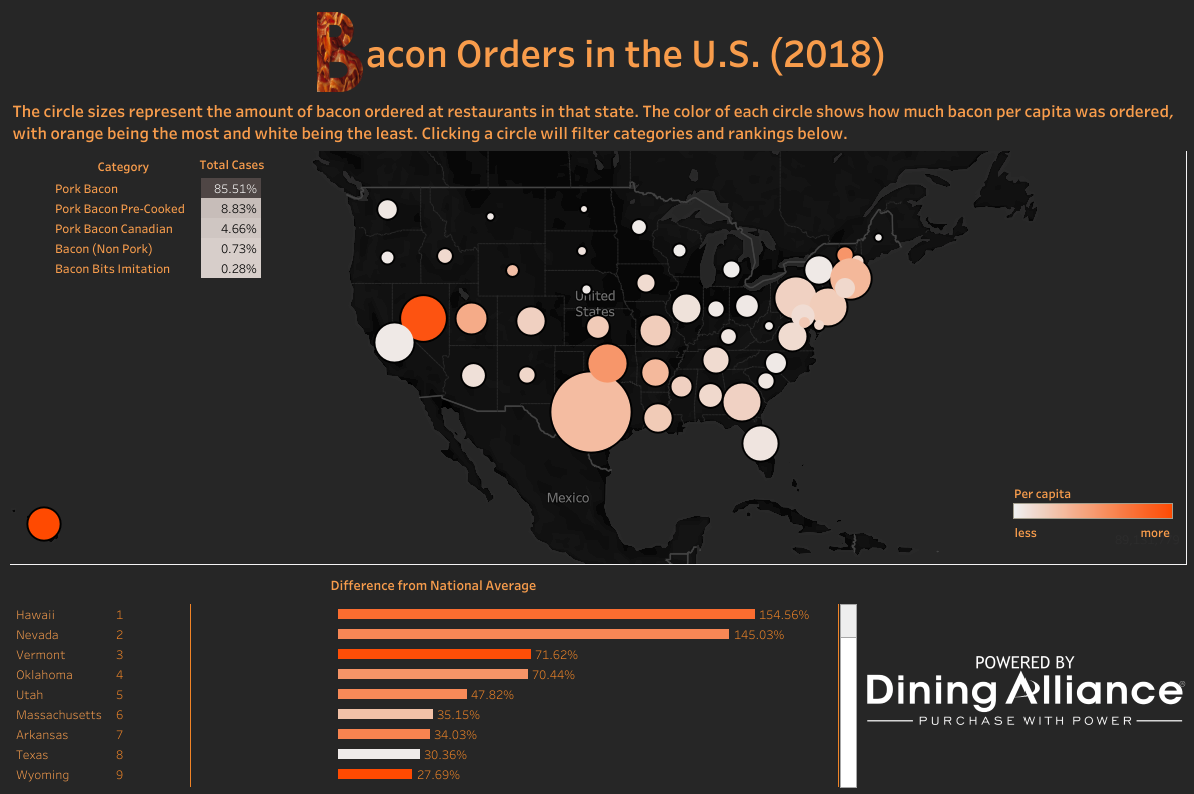
Hawaii and Nevada have the most bacon-obsessed restaurant customers in the U.S., and Alaska has the least. That's according to data from the Dining Alliance, the nation's largest group purchasing organization for restaurants.
Dining Alliance analyzed orders for more than 1.7 million cases of bacon by its member restaurants in 2018. On a per capita basis, Hawaii was at the top of the list with per capita orders that were 154 percent higher than the national average. Alaska was at the bottom of the list with orders that were nearly 24 percent less than the national average. For every one piece of bacon ordered at restaurants in Alaska, diners in Hawaii ordered a whopping 54 pieces.
"Having Hawaii and Nevada at the top of the list makes sense when you think about the kind of dining that happens there," said Christina Donahue, president of Dining Alliance. "Hawaii and Nevada are vacation destinations. When people are on vacation they go out to eat more often and tend to splurge when they do. That means more extra sides of bacon at breakfast and more bacon on top of burgers at lunch and dinner. And of course, the grand buffet culture at Las Vegas casinos adds to the sheer pounds of bacon those operators go through."
The state with the most restaurant bacon orders was Texas with more than 245,000 cases of bacon sold. But when calculated on a per capita basis, Texas ranks 8th among all 50 states.
A complete listing of the per capita restaurant bacon orders is below.
Bacon prices fluctuate throughout the year based on seasonality, import/export trends, global political issues, weather, and other factors. In 2018, the price of a case of bacon dropped 11.47 percent for Dining Alliance members, Donahue said.
"Bacon is big business," she said. "It's obviously a staple for any place that serves breakfast. For lunch and dinner, bacon becomes a premium add on to many dishes that can drive profitability."
In addition to helping restaurants save money on their bacon purchases by pooling together their purchasing power, Dining Alliance also advises restaurants on the best kinds of bacon to buy depending on how they plan to serve it.
"We often see restaurants using the exact same kind of bacon when they serve it by itself for breakfast or as a topping on cheeseburgers," Donahue said. "That's not always the best way to go. Long, thin bacon looks great filling up a breakfast plate, but it may make more sense to use a shorter, thicker piece on top of a burger."
States with the most restaurant bacon consumption per capita, 2018:
Hawaii 154.56 percent higher than the national average
Nevada 145.03 percent higher than the national average
Vermont 72.62 percent higher than the national average
Oklahoma 70.44 percent higher than the national average
Utah 47.82 percent higher
Massachusetts 35.15 percent higher
Arkansas 34.03 percent higher
Texas 30.36 percent higher
Wyoming 27.69 percent higher
Washington, DC 16.82 percent higher
Louisiana 15.28 percent higher
Kansas 14.20 percent higher
New Jersey 12.75 percent higher
Missouri 12.45 percent higher
Mississippi 8.33 percent higher
Colorado 8.24 percent higher
Pennsylvania 7.525 higher
Georgia 7.11 percent higher
Rhode Island 6.77 percent higher
New Hampshire 3.59 percent higher
New Mexico 1.96 percent higher
Connecticut .36 percent higher
Alabama .27 percent lower than the national average
Delaware .34 percent lower than the national average
Idaho .90 percent lower than the national average
Tennessee 2.56 percent lower than the national average
Iowa 2.70 percent lower
Virginia 2.93 percent lower
Maryland 2.97 percent lower
Arizona 7.945 lower
Illinois 9.90 percent lower
South Dakota 10.10 percent lower
Florida 12.64 percent lower
South Carolina 14.08 percent lower
Kentucky 14.36 percent lower
North Dakota 14.75 percent lower
Washington 15.10 percent lower
Montana 16.48 percent lower
Ohio 16.60 percent lower
Oregon 16.65 percent lower
North Carolina 17.10 percent lower
New York 17.20 percent lower
Indiana 17.30 percent lower
California 17.40 percent lower
Nebraska 17.82 percent lower
West Virginia 18.14 percent lower
Minnesota 18.27 percent lower
Maine 19.66 percent lower
Michigan 20.36 percent lower
Wisconsin 20.61 percent lower
Alaska 23.92 percent lower
Cover photo: iStock
Related Media
Subscribe
Get the latest news and resources from Fast Casual.
Recent Posts